In today's digital era, securing databases matters more than ever. Global businesses and organisations rely on DBMSs to store a lot of sensitive information, so the risk of targeted attacks and breaches keeps growing. Monitoring new actors and their techniques is part of the job.
This article looks at general patterns and trends in database attacks across different regions. The data came from honeypot sensors distributed worldwide. The network showed clear differences in the frequency, intensity and type of attacks against individual database systems.
Some databases received credential brute-force attempts far more often than others. Botnets repeatedly tried usernames and passwords, but the activity was not evenly spread.
There were also useful correlations between the attributes collected during the research. They help explain some of the characteristics of these database attacks.
Global Honeypot Project
A database honeypot is a useful way to identify and analyse potential threats. To get a better view of attacks worldwide, Trustwave deployed honeypots in several countries. This made it possible to collect information about the methods used by attackers and their botnets. The project used Low Interaction Honeypot software, so it collected login attempts and data around the login process.
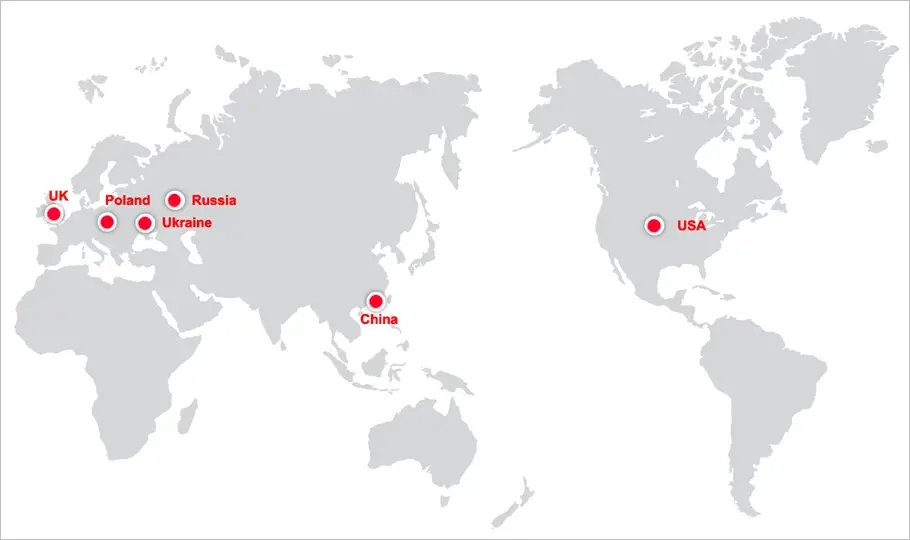
At the beginning of December 2022, sensors were placed in Russia, Ukraine, Poland, the UK, China and the United States. The choice put emphasis on Central Europe and the tense situation there. Two sensors in each country made it possible to look for activity tied to a particular region or country.
The data in this article covers four months, starting in early December 2022.
Databases
We selected nine popular database systems: MS SQL Server (MSSQL), MySQL, Redis, MongoDB, PostgreSQL, Oracle DB, IBM DB2 for Unix and Windows, Cassandra and Couchbase. The database servers listened on their default TCP ports.
The list was intentionally mixed. It covers the usual relational databases, an in-memory store, document databases and distributed platforms. The goal was not to test an unusual configuration or security through a non-standard port. It was to see what finds a normal, exposed installation first.
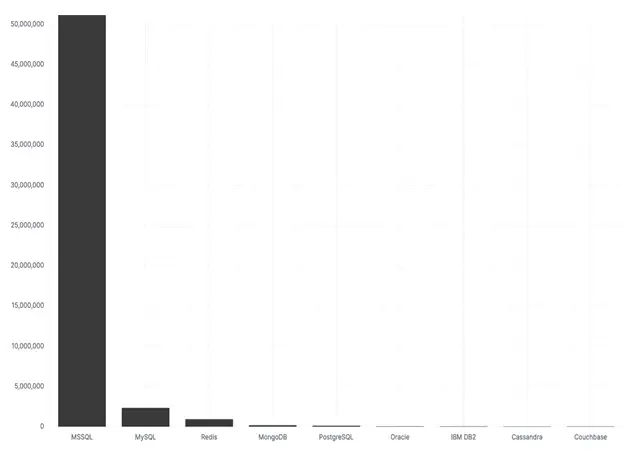
It quickly became clear that MSSQL activity was much higher than for the other databases. The difference was so large, more than 93 percent of all activity, that comparing the remaining DBMSs was sometimes difficult. MySQL figures include MariaDB, Percona for MySQL and other DBMS flavours based on the MySQL protocol.
This was useful on its own. It shows how uneven opportunistic scanning is. An exposed database is not just an exposed database from the internet side. The product, the default account names and the number of reachable instances all change how interesting it is for a botnet.
Sensor's Net
One goal was to tell country-specific attacks apart from server-specific attacks. That is why each country got two sensors. The second IP address was chosen as far as possible from the first inside that country's range, avoiding near-neighbour addresses such as x.x.x.99 and x.x.x.100. This helped separate random traffic from targeted activity and showed more about the nature of the attacks.
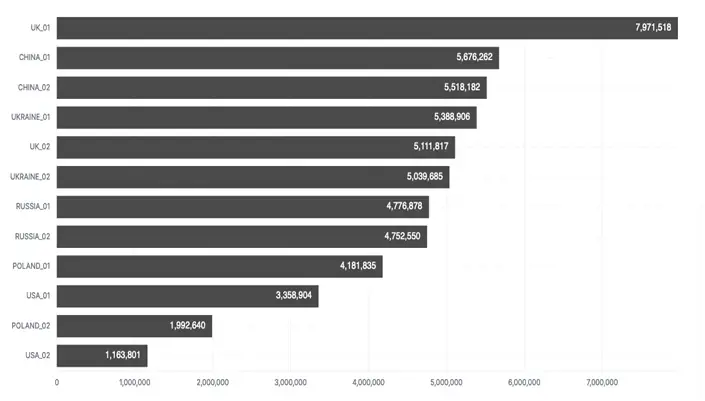
This paired setup is what makes the country comparison useful. One sensor only tells you what happened to one address. Two sensors in the same country, placed in different parts of the range, give a much better hint whether a botnet is picking a region or just sweeping the internet.
Attack intensity
The histogram in Figure 04 shows the frequency and intensity of attacks against all sensors over time. Figure 05 shows the number of unique IP addresses recorded during the research period.
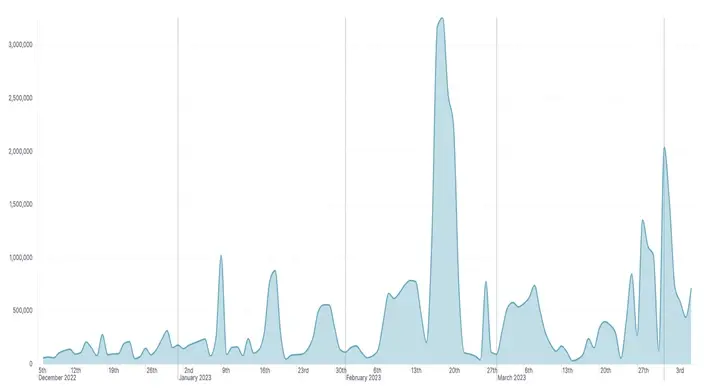
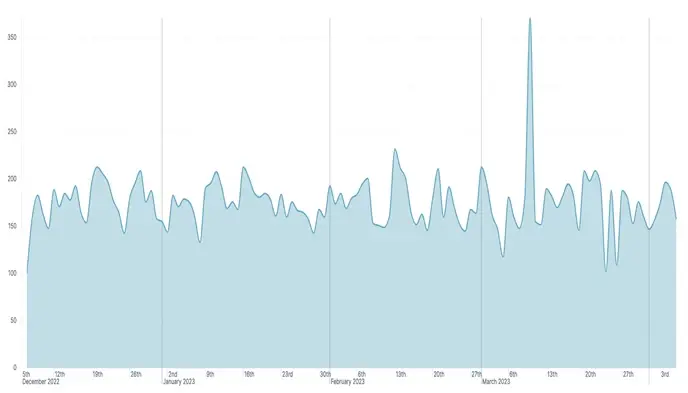
Figure 04 is the sum of all brute-force login attempts on all listening database ports. The visible peaks are MSSQL attacks. The rest are very small compared with MSSQL.
The traffic was not a constant background noise. It arrived in bursts, then went quiet again. That looks more like distributed infrastructure receiving a task and moving on than one host sitting there and guessing forever. We cannot see the operator behind it from a low-interaction honeypot, but the timing is still useful when looking at how these campaigns run.
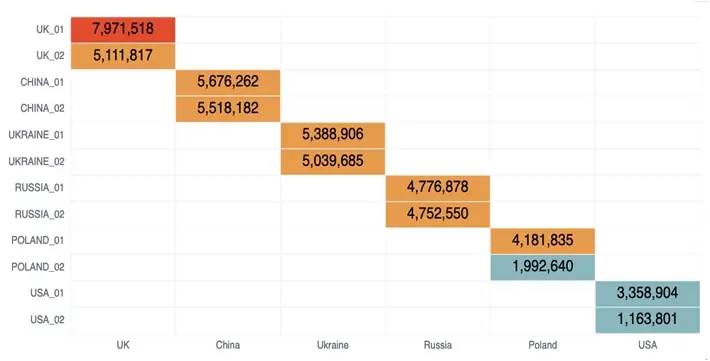
Early in the project, one surprise was the large difference between countries. Attackers were clearly drawn to the UK sensors. The paired-sensor approach showed that activity in a country followed a similar order on both sensors. Most attacks were aimed at a country IP range on purpose, not random global scanning for any host to extend a botnet.
The UK stood out across more than one database type, not only MSSQL. That does not prove why the range was selected, but it makes a simple random-address explanation less convincing. The useful part is the shape of the traffic: both UK sensors saw the same broad pattern even though they were separate addresses.
Threats and Observations
After four months, the difference in attack intensity between databases was drastic.
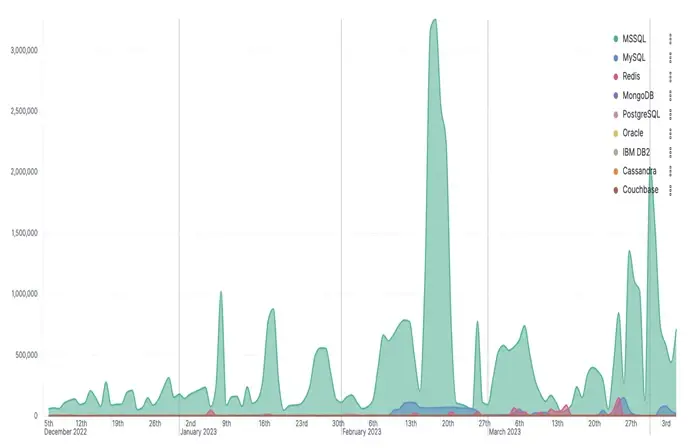
MSSQL made up more than 93 percent of all attack activity. Once MSSQL is removed, many more details become visible.
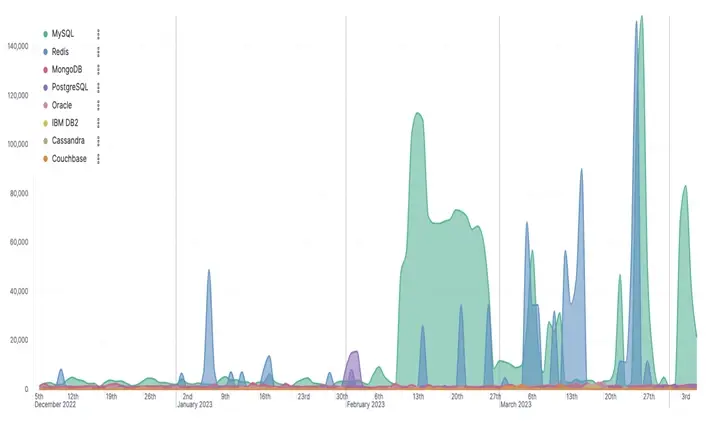
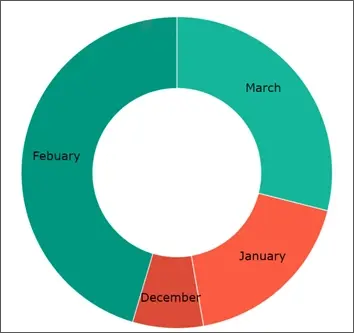
Individual attacks became much easier to see. Their peaks show intensity, frequency and duration. December and January were fairly calm, which may suggest bots were waiting for commands and targets from a C2 operator. The sensors had already been running several weeks before the official 6 December start date, so December should not be read as a honeypot start-up period.
Once MSSQL is taken out of the chart, the smaller campaigns stop looking flat. MySQL and Redis have their own spikes and quiet periods. They are smaller, but they are not random leftovers. They look like separate campaigns with different target lists, timing and probably different operators.
After MSSQL, MySQL and Redis were the most attacked databases. The biggest MySQL and Redis peaks reached around 150,000 login attempts, compared with more than 3,000,000 for MSSQL.
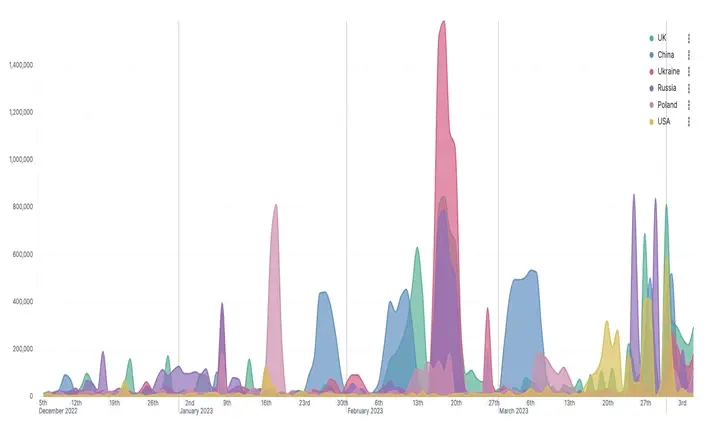
The UK received the largest overall number of attacks. Ukraine saw its heaviest brute-force attack around 19 February, setting an intensity record. That particular attack came from just five IP addresses.
That is another reason not to judge an event only by the number of source IPs. A small group can generate a lot of login attempts when it is coordinated. In this case, five systems were enough to make the strongest Ukrainian spike in the dataset.
MSSQL
MSSQL attacks were very intense. Shodan reported more than 450,000 MSSQL instances exposed to the internet, with more than 133,000 in China.
For this dataset, MSSQL was the centre of gravity. More than 93 percent of all recorded login attempts went to this one service. That is not just a small lead over the rest. It changes the scale of the whole chart and hides most of the smaller campaigns until MSSQL is removed.
The paired sensors confirm that botnets aimed at exact country IP ranges or regions, not the whole IP space. The UK and China are major communication hubs for many industries and corporations, which may help explain the intensity. Ukraine and Russia also had similar high scores.
At least some of the traffic was clearly regional. The same ordering appeared on both sensors in a country, while the totals between countries could be very different. That is what we expected from a target list built around ranges or locations, not from a simple sweep of every address it could reach.
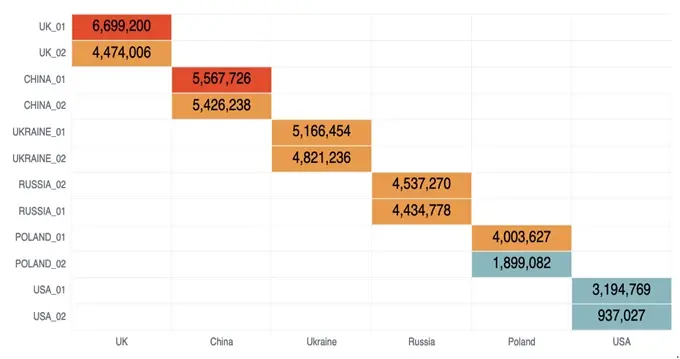
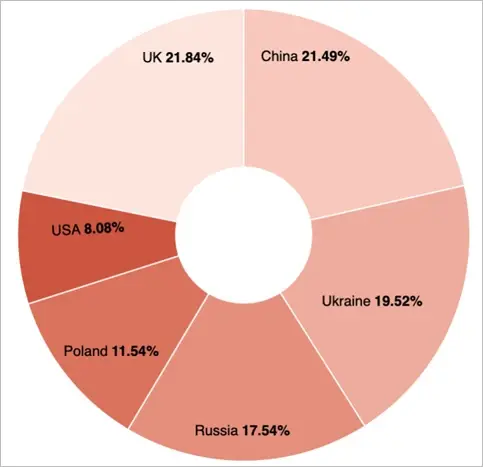
Figure 10 shows a clear peak around 19 February. Figure 13 lists the IP addresses recorded within two days of that event.
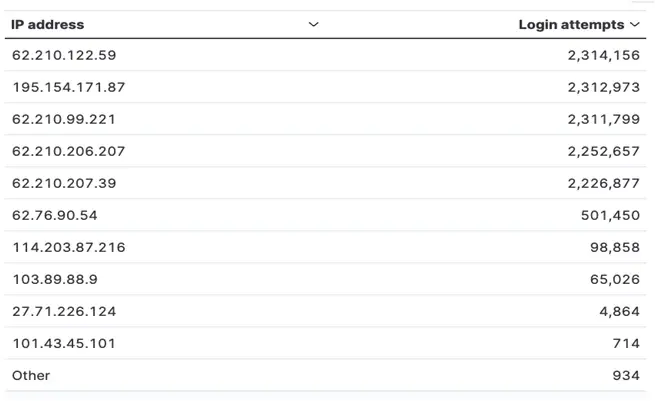
Five addresses had similarly high scores: 62.210.122.59, 195.154.171.87, 62.210.99.221, 62.210.206.207 and 62.210.207.39. All were in France and had little reputation activity in services such as VirusTotal and OTX AlienVault.
This is a good reminder about reputation data. The lack of a bad label did not make the activity less obvious in the honeypot logs. Reputation feeds are helpful context, but they usually describe what has already been reported somewhere else. They are not a replacement for watching what an address is doing now.
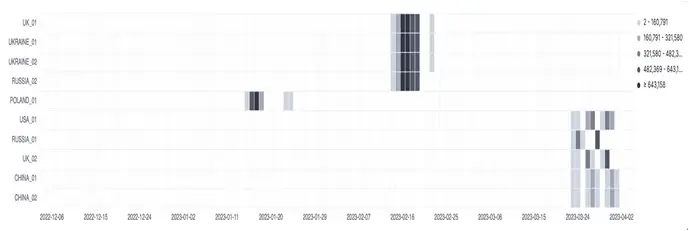
This IP group operated in limited and selective regions. We only saw it a few times and never again. Other IP addresses operated constantly with random intensity, but were always nearby.
The short lifetime is also interesting. A campaign can be loud for a day or two and then disappear completely, either because the infrastructure moved, the list was exhausted or the operator changed task. If you only look at weekly averages, that kind of activity gets lost very easily.
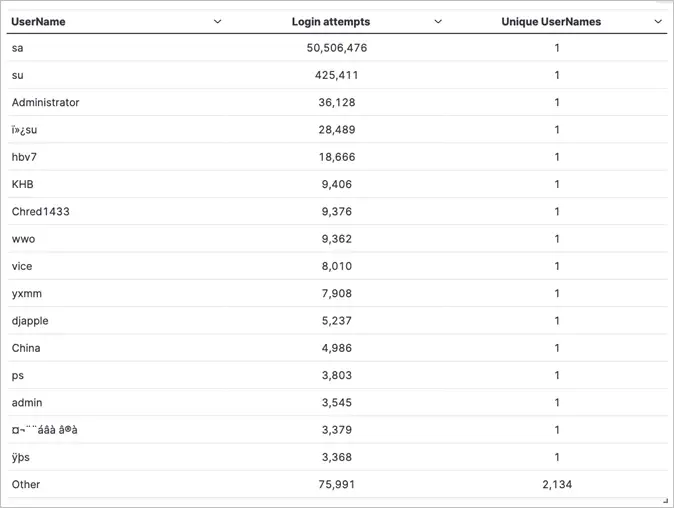
No surprise, sa was the main account tested. There were dictionary attacks against passwords and usernames, with more than 2,100 different usernames tested in MSSQL attacks.
That is more than a quick scan with a few default credentials. Somebody had a large username list and kept feeding it into exposed MSSQL servers. The account name may be boring, but it still gives attackers a very good first guess.
The first defence here is still boring too, but it works: do not expose the service if you do not need to, remove or rename default administrative access where the product supports it, and make sure password policy is not doing the attacker a favour. These bots do not need a clever exploit when common credentials are enough.
MySQL
Shodan reported more than 3.6 million MySQL instances exposed to the internet. One goal of this project was to check botnet activity in MySQL attacks. The data showed that MySQL remained an attractive target.
Attack intensity on individual MySQL sensors differed much more than for MSSQL.
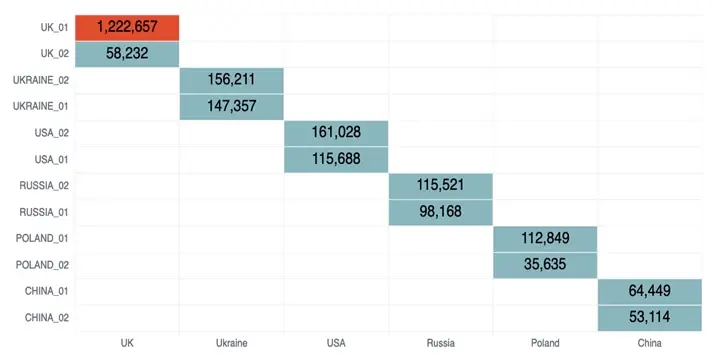
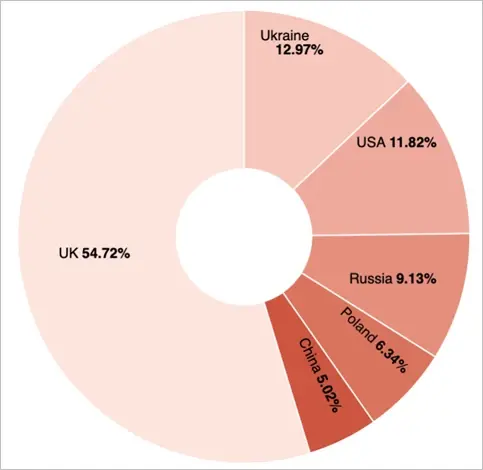
The UK_01 sensor received the main part of the attack, while UK_02 received much less. For unknown reasons, UK_01 caught the attention of the attackers. The other sensors saw slower activity without any major events.
MySQL did not follow the MSSQL pattern exactly. The difference between the two UK sensors was much bigger, which suggests a more specific target selection or a list that happened to include one address. This is why having a second sensor matters. With only UK_01, it would be easy to call the whole country equally hot.
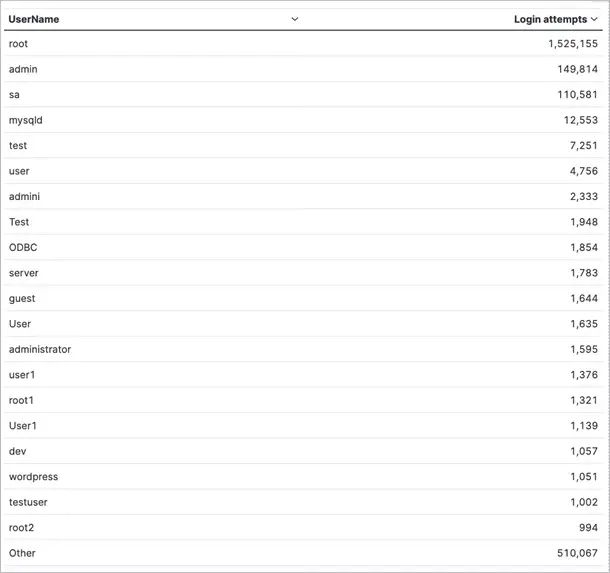
Unlike MSSQL and the sa account, MySQL attacks used root plus many other common usernames.
The wider username set also fits how MySQL is normally deployed. Apart from root, applications often have their own service accounts, so a larger dictionary makes sense for an attacker. It is still mostly automated work, but it is a little less one-dimensional than the MSSQL traffic.
Redis
The high activity on tcp/6379 was no surprise. Redis is a relatively young database, launched in 2009, but it is becoming more popular with attackers too. Shodan reported more than 270,000 Redis instances and more than 600,000 instances with open port 6379/tcp.
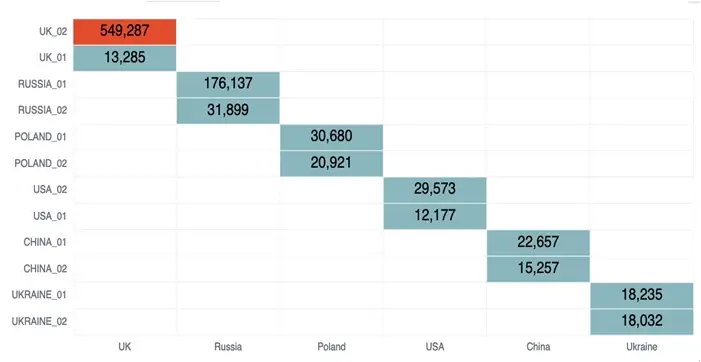
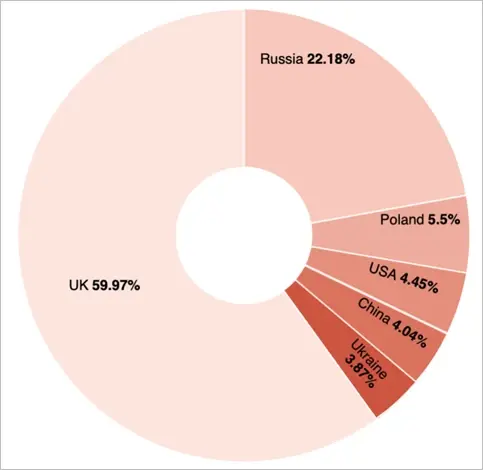
The UK was again the most attractive region for attackers, followed by Russia. Attacks against Redis were less common in the other countries, but the threat was still there.
Redis is a different case from a normal username-and-password database. A poorly exposed instance may be interesting simply because the port answers. For an attacker, that can be enough to try the next stage. The honeypot only records the login side here, so it cannot show everything that would happen against a real reachable server, but the attention around tcp/6379 is still worth taking seriously.
Other Databases
We also monitored login attempts against other databases. They were not discussed in detail, but the sensors still collected useful information about them.
Threat actors showed less interest in these solutions, but they can still be targets and should be secured properly.
Lower traffic does not mean a database is safer. It can simply mean that mass scanners are not looking for it today. A targeted attacker does not need the same popularity or volume to be a problem.
There is a practical point here. Less popular services can look quiet in a public scan and still be a serious risk inside an organisation. Once somebody knows the environment or finds a useful target, they do not need millions of random attempts. One good attempt is enough.
Research Summary
The goal of this research was to monitor database threats globally, describe them and identify areas for later work. Low Interaction Honeypots across nine databases provided useful information despite their limited capabilities.
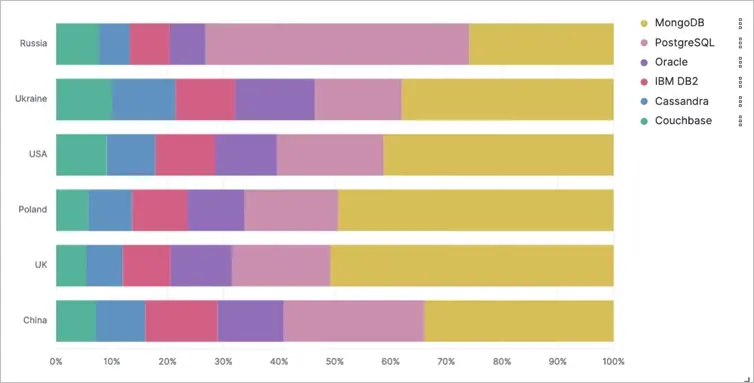
Databases were not attacked with equal intensity. MSSQL and MySQL received far more access attempts than Oracle or IBM DB2. The reasons can include how common a database is, what type of data it holds, its role in corporate or government environments and known weak points.
The project also shows why geography should not be ignored. The same exposed service did not receive the same traffic everywhere. Some attacks followed broad internet patterns, while others looked much more deliberate and regional. A single exposed host tells only a small part of that story.
Database security still needs basic work: strong unique passwords, unusual usernames, secure authentication, disabled default accounts, MFA where available, access monitoring, regular updates and security audits.
None of this is exotic. The important bit is doing the basic work before a botnet finds the service. The traffic in this research was patient, automated and large enough that somebody, somewhere, will eventually try the obvious credentials.
Vulnerability scanners such as Trustwave AppDetectivePro or DbProtect can help with reporting, auditing and checking controls against requirements such as DISA-STIG, CIS, GDPR, HIPAA or PCI-DSS.